DATA COLLECTION
TOTAL FOOD WASTE
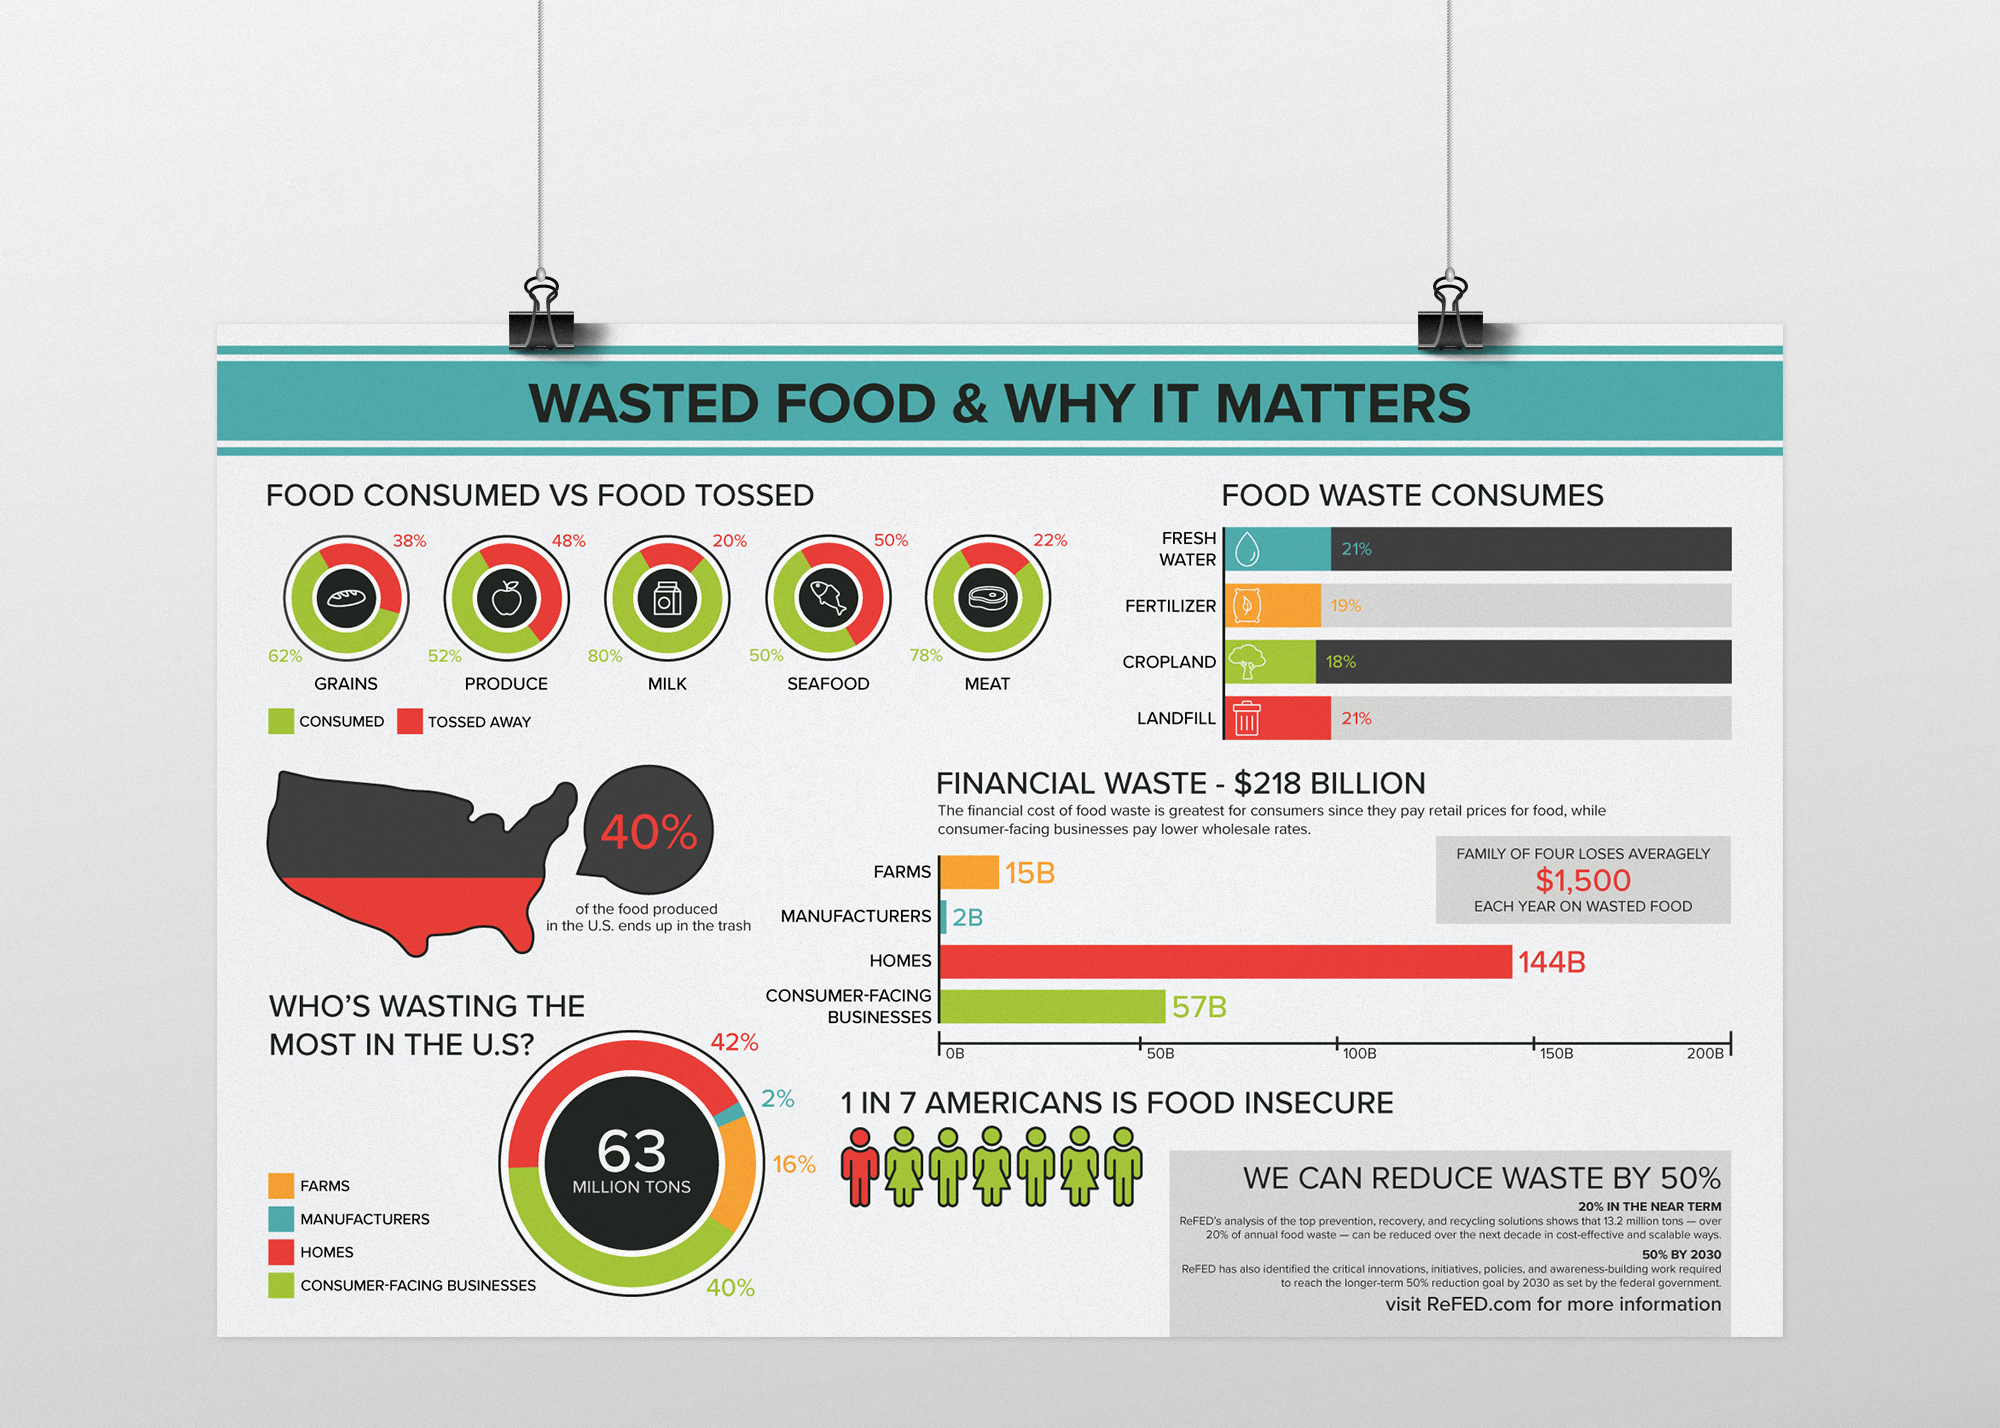
63 Million Tons
FARM
16%
MANUFACTURERS
2%
CONSUMER-FACING BUSINESSES
40%
HOME
43%
1 in 7 Americans is food insecure
FINANCIAL WASTE
$218 Billion total
FARM
$15 Billion
MANUFACTURERS
$2 Billion
CONSUMER-FACING BUSINESSES
$57 Billion
HOME
$144 Billion
A family of four loses $1,500 each year on food it throws away.
The financial cost of food waste is greatest for consumers since they pay retail prices for food, while consumer-facing businesses pay lower wholesale rates.
RESOURCE WASTE
FRESH WATER
21%
FERTILIZER
19%
CROPLAND
18%
LANDFILL
21%
40% percent of the food produce in the U.S ends up in the trash
FOOD CONSUMED VS FOOD TOSSED AWAY
PRODUCE
40% consumed
52% tossed away
MEAT
78% consumed
22% tossed away
SEAFOOD
50% consumed
50% tossed away
MILK
80% consumed
20% tossed away
GRAINS
62% consumed
38% tossed away